
A huge number just dropped, and it says India has almost wiped out extreme poverty, but not everyone agrees that's the full story.
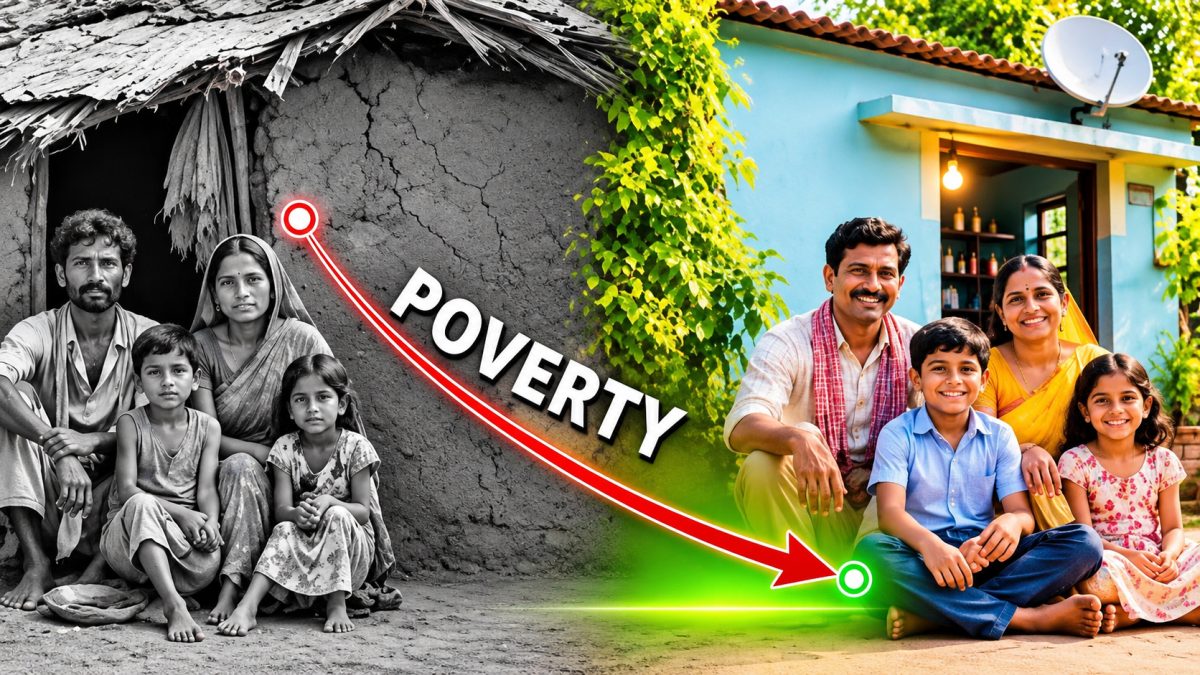
The World Bank says India's extreme poverty rate fell from 27.1% in 2011 to 2.6% in 2023, one of the fastest declines ever recorded for a country this large. The number comes from a September 2026 update to the World Bank's Poverty and Inequality Platform, and it uses a strict benchmark of $3 per person per day in 2021 purchasing power terms.
India Windfall Tax Diesel Exports Jump as Petrol Levy Drops to Zero
India poverty decline numbers explained
Under this measure, anyone spending less than $3 a day is counted as living in extreme poverty. Back in 2011, more than a quarter of India's population fell under that line. By 2023, that number had shrunk to just 2.6%, according to the World Bank's published findings. That puts India below the 3% mark that groups like the World Poverty Clock often use to describe extreme poverty as basically eliminated.
The drop looks even bigger when you use a slightly higher bar. At the $4.20-a-day line, which the World Bank applies to lower-middle-income countries, India's poverty rate fell from 57.7% to 16.1% during the same twelve years. That shift meant roughly 496 million people moved above that poverty line, based on the World Bank's own brief on India.
₹2,814 Crore Critical Mineral Processing Scheme Gets Cabinet Nod
World Bank India poverty rate sparks fresh debate
The Times of India covered the numbers with a clear warning attached. The outlet called the decline significant but said there's a catch, pointing out that crossing a statistical threshold doesn't mean every household is financially secure. Millions of people now sit just above the $3 line, which means a job loss, a medical bill, or a bad harvest could push them right back under it.
Al Jazeera reported the same figures, noting that India lifted close to 500 million people above the poverty line even as inequality kept widening elsewhere in the economy. That combination, fewer people in extreme poverty but a growing gap between rich and poor, is shaping how researchers talk about India's economic story right now.
Survey methods complicate the 2011-2023 comparison
The Wire raised a sharper concern. It reported that India's newer consumption surveys, covering 2022-23 and 2023-24, were collected very differently than the 2011-12 survey that forms the baseline. The newer data reportedly came from three separate household visits and used different recall periods, meaning the time window people were asked to remember their spending over changed. That matters because recall periods can shift how much consumption gets reported, especially for food purchases people buy often.
Critics argue that mixing an old income distribution with new price adjustments and newer survey techniques can make the poverty drop look bigger than it really is. The Wire's reporting suggests the 2011-12 and 2022-23 numbers shouldn't be read as one smooth, comparable timeline, even though headlines often present them that way.
The Center for Global Development added another layer to this debate. Researchers there pointed out that India's real GDP per person grew by about 74% over the same period. When they ran a simple calculation holding the 2011 income distribution steady, poverty came out closer to 6%, not 2.6%. That's not an official competing estimate, but it shows how much the final number depends on assumptions about how income got distributed across households.
What the poverty numbers mean for daily life in India
Business Today framed the numbers from a different angle, pointing out that a large share of Indians still live on very modest daily budgets even after crossing the extreme poverty line. The $4.20 threshold data makes this clear. While only 2.6% of Indians fall under the strictest poverty measure, 16.1% remain below the broader line, which is still a huge number of people when applied to India's population.
So the real debate isn't just whether poverty fell. It's about how much it fell, whether the comparison between 2011 and 2023 holds up under scrutiny, and what life actually looks like for households sitting just above these statistical lines. Rising wages, better access to banking, subsidized cooking fuel, electricity connections, and direct cash transfer programs all likely played some role in the decline, but no single study has cleanly separated out how much credit each factor deserves.
Next steps for measuring India's progress
Economists now want a cleaner, harmonized poverty series that accounts for the survey design changes between 2011-12 and the newer rounds. Until that happens, expect continued disagreement over whether 2.6% truly reflects reality or overstates progress. For most Indian households, the more pressing questions are about job stability, food prices, and whether public services keep improving, not which side of a statistical line they technically fall on.